
|
Lane Closure Decision Support System (LCDSS)Help and User Manual |
Selecting a lane closure location (selectfeature.aspx) |
|
This page is where you select where the lane is to be closed. First, choose the county in which you wish to close a lane. A list of routes in your selected county will then be displayed. Select a route, then a direction in which you wish to close a lane. Finally, click a feature where the lane is to be closed and click "Input Closure Information." You will then be taken to the input closure page. Note: if you go to the input closure page and click "back" in your browser, only the county selection is remembered. Change the county selection to get the routes to appear again, then go back through the county, route, direction and feature selection process before submitting the location information again. |
Input information about a lane closure (inputclosure.aspx) |
|
This is where details about the closure are input. The current month is automatically selected. Select the month in which you plan to close a lane. The number of lanes to be closed must be selected. If there are only two lanes in the direction you are closing a lane, the only option is 2:1, indicating a 2 lane roadway with 1 lane open. You may not currently use LCDSS to estimate queues from a complete closure (e.g., 2:0 or 3:0). Next, enter the length of the construction zone from the point where the lane(s) is(are) completely closed to the end of the construction zone. Enter the planned speed limit through the zone. Finally, you may wish to only see hours in which a certain threshold (in delay or queue length) is exceeded. The default range and color scheme is 0-15 minutes (green), 15-30 minutes (yellow) and more than 30 minutes (red) for delay and 0-0.75 miles (green), 0.75-1.5 miles (yellow) and greater than 1.5 miles (red) for queue length. If you select a threshold, values that exceed your selected value will be highlighted in red. There is no yellow for manually-selected threshold values. Sometimes on this page you will get an error that there is not enough data to support the application. Typically, this is in urban areas where determining the flow of traffic by direction and hour was not possible using data the department currently owns. LCDSS was designed to handle primarily rural and suburban roadways. |
Interpret results (queues.aspx) |
|
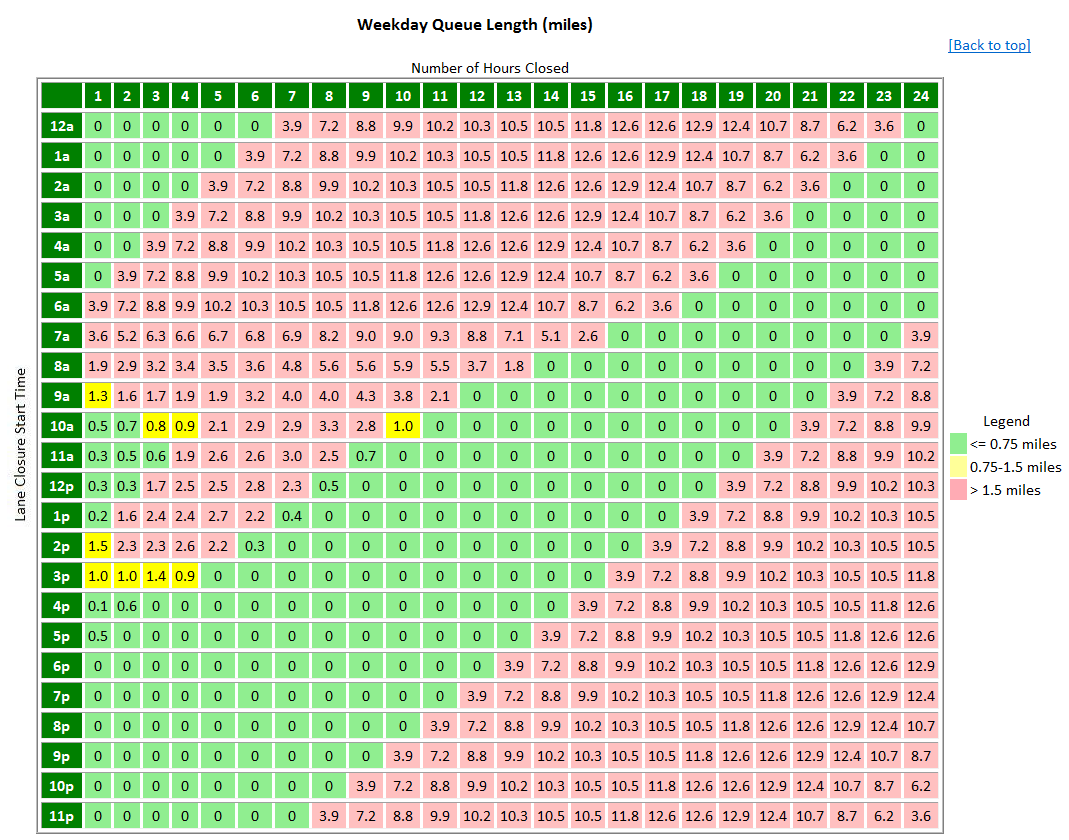
Once the location of the closure and details have been specified, the system is ready to generate results. You will noticed the 24 rows by 24 columns nature of the output tables for weekday and weekend queue length and weekday and weekend delay. The following image is an example of the delay results: |
|
The lane closure start time (the rows of the table) is where you start reading. Let's assume you wish to close a lane starting at 9:00 a.m. Starting at the 9:00 a.m. hour and reading left to right, you will see that if you close the lane at 9:00 a.m. there will be a 1.3 mile backup at 10:00 a.m. (after one hour of the lane being closed). In this instance, there will be a traffic backup until 8:00 p.m. (after 11 hours of being closed). Using the same chart, let's assume another scenario. You need to have the lane closed for at least 10 hours to get the work done. If you want the queue length to always be under 0.75 miles (green), there are only a few hours that you could start work. It is easiest to read down the rows (when the lane will be closed), then look to the right to see how many hours the lane can be closed until there is a queue again. In this case, the earliest you could start work would be 4:00 p.m. and the latest would be 8:00 p.m. If you start at 8:00 p.m. you have exactly 10 hours to do the work, a backup will start sometime after 6:00 a.m. the next day. If you start at 4:00 p.m. you have 14 hours to get the work done. The additional delay results are very similar. Delay is how many more minutes it takes for a motorist to get through the traffic backup and construction zone due to the closure compared to normal, free-flow conditions. If you wish to look at some of the detailed numbers and variables used to calculate the queues and delays, click anywhere on the green panel ("Show Detailed Calculations...") to view these. If you wish to close these calculations, you will notice the text on the green panel changed from "Show" to "Hide." Click the green panel again to hide the variables. |
 |